Points
Variation
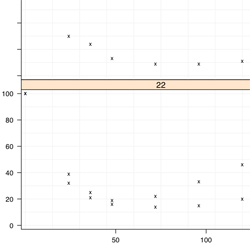
Use
- To plot the points on the graph
Arguments
- points.x
- - All X values of points that will be plotted
- points.y
- - All Y values of points that will be plotted
- points.symbol
- - Defaulted to "x". The default when plotting a regular plot is "o".
- points.size
- - Default is 1
- points.color
- - Default is "black". May be replaced with rgb() or color system.
Notes
- Almost always plotted last, unless under an a-b-line
Code
'plot.points' <-
function(
  points.x = x,
  points.y = y,
  points.symbol = "x",
  points.size = 1,
  points.color = "black"
){
cat("\nPlotting Points\n")

  panel.xyplot(
    x = points.x,
    y = points.y,
    pch = points.symbol,
    cex = points.size,
    col = points.color
  )
}
Legend Info
key = list(
  title = "Legend",
  text = list(
    c("Points"),
    col="black"
  ),
  points = list(
    col = c("black"),
    pch = c(4),
    cex = c(1)*0.75
  ),
  lines = list(
    col = c("black"),
    lwd = c(1)*0.75,
    lty = c("blank")
  ),
  type = "l",
  space = "right",
  cex.title = 1,
  cex = 0.75
)