Quantiles
Variation
Use
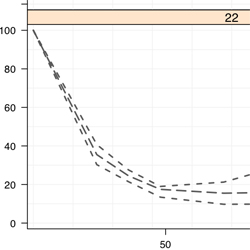
- To plot a lower, 50%, and upper quantile
Arguments
- quantile.data
- - A List including:
- x
- - All X values of points that will be plotted
- y
- - All Y values of points that will be plotted
- alpha
- - A percentage from 0 and 1
- - Ex. alpha == .05, the quantiles produced are 5%, 50%, 95%.
- quantile.type
- - Specifies what method should be used for calculating the quantiles. See the Documents for more information.
Notes
- quantile.data must be supplied in the panel function.
- The X and Y data may be from a different data set than the data being plotted in the other panel functions
- Quantile data does NOT need to have the same amount of lines as the rest of the data being plotted
- Quantile data does NOT need to have all of the necessary columns
- Quantile data is NOT packet dependent, therefore each packet has the same plot.quantiles() output
Code
'plot.quantiles' <-
function(
  quantile.data = quantiles.to.plot.in.panel,
  quantile.type = 7
){
cat("\nPlotting Quantiles\n")

  quan.x <- quantile.data$x
  quan.y <- quantile.data$y
  quan.alpha <- quantile.data$alpha

  fifty.percent.line <- tapply(quan.y, quan.x, quantile, probs = 0.5, type = quantile.type)
  nintyfive.percent.line <- tapply(quan.y, quan.x, quantile, probs = (1-quan.alpha), type = quantile.type)
  five.percent.line <- tapply(quan.y, quan.x, quantile, probs = (quan.alpha), type = quantile.type)

  quantile.colors <- c("grey35","grey35")
  quantile.lty <- c("dashed","longdash")

  panel.lines(names(five.percent.line),(five.percent.line), col=quantile.colors[1],lty=quantile.lty[1],lwd=2)
  panel.lines(names(fifty.percent.line),(fifty.percent.line), col=quantile.colors[2],lty=quantile.lty[2],lwd=2)
  panel.lines(names(nintyfive.percent.line),(nintyfive.percent.line), col=quantile.colors[1],lty=quantile.lty[1],lwd=2)

}
Legend Info
key = list(
  title = "Legend",
  text = list(
    c("Quantiles"),
    col="black"
  ),
  points = list(
    col = c("grey35"),
    pch = c(NA),
    cex = c(1)*0.75
  ),
  lines = list(
    col = c("grey35"),
    lwd = c(2)*0.75,
    lty = c("dashed")
  ),
  type = "l",
  space = "right",
  cex.title = 1,
  cex = 0.75
)