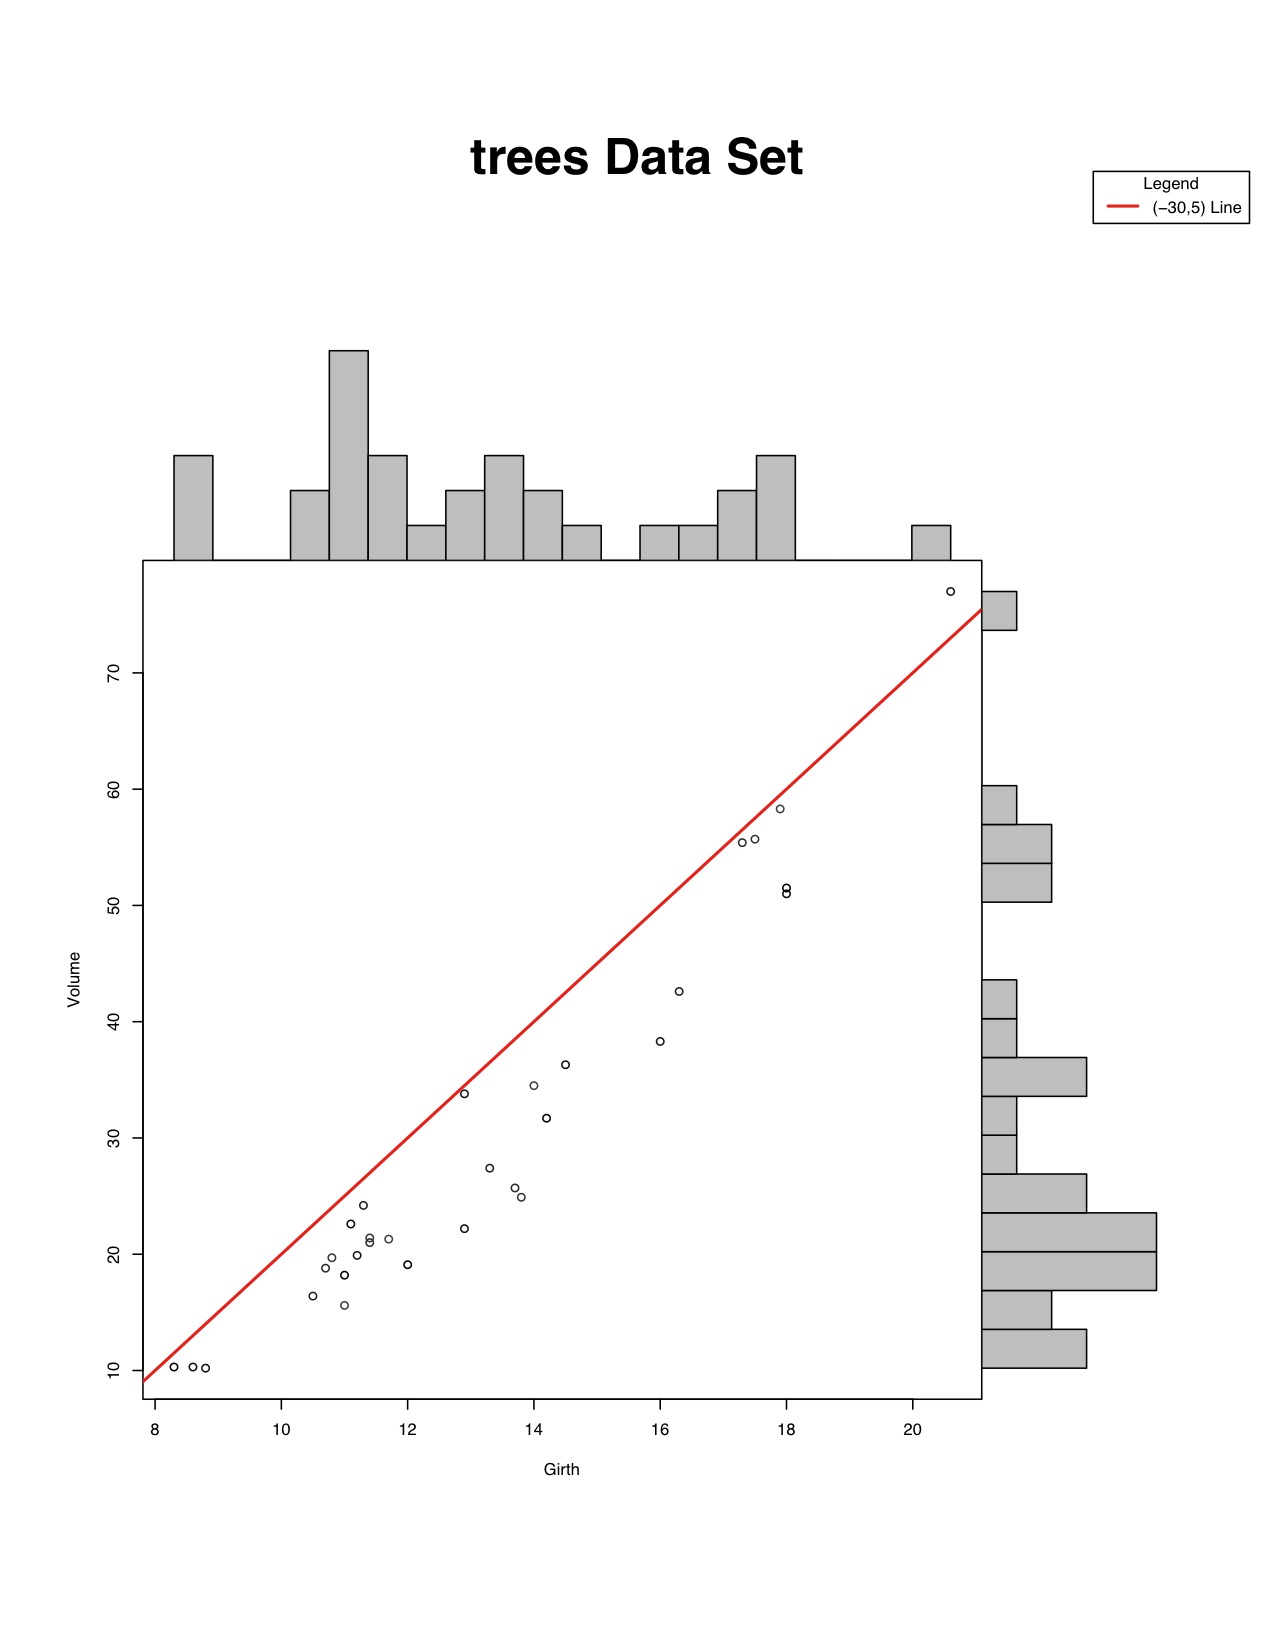
Y~Y Plot
Example - Points, a-b-line, Loess, and Histogram
 |
Code Used
### Using a toy data set due to example data sets not having more than one Y variable

#pdf(file="F:/Website/yyplot/base/baseyy-points-abline-large.pdf", width = 8.5, height = 11)
Import
Data
Data
### Import Data
require(datasets)
head(trees)
### End Import
Set up/Plot
the graph
the graph
### Make Y~Y Plot
yyplot(
  x.column = "Girth",
  y.column = "Volume",
  data=trees,
  title.of.all.plots = "trees Data Set",
  xlab="Girth",
  ylab="Volume",
  abline.list = list(
    intercept = c(-30),
    slope = c(5),
    color = "red",
    legend = "(-30,5) Line"
  ),
)
#dev.off()