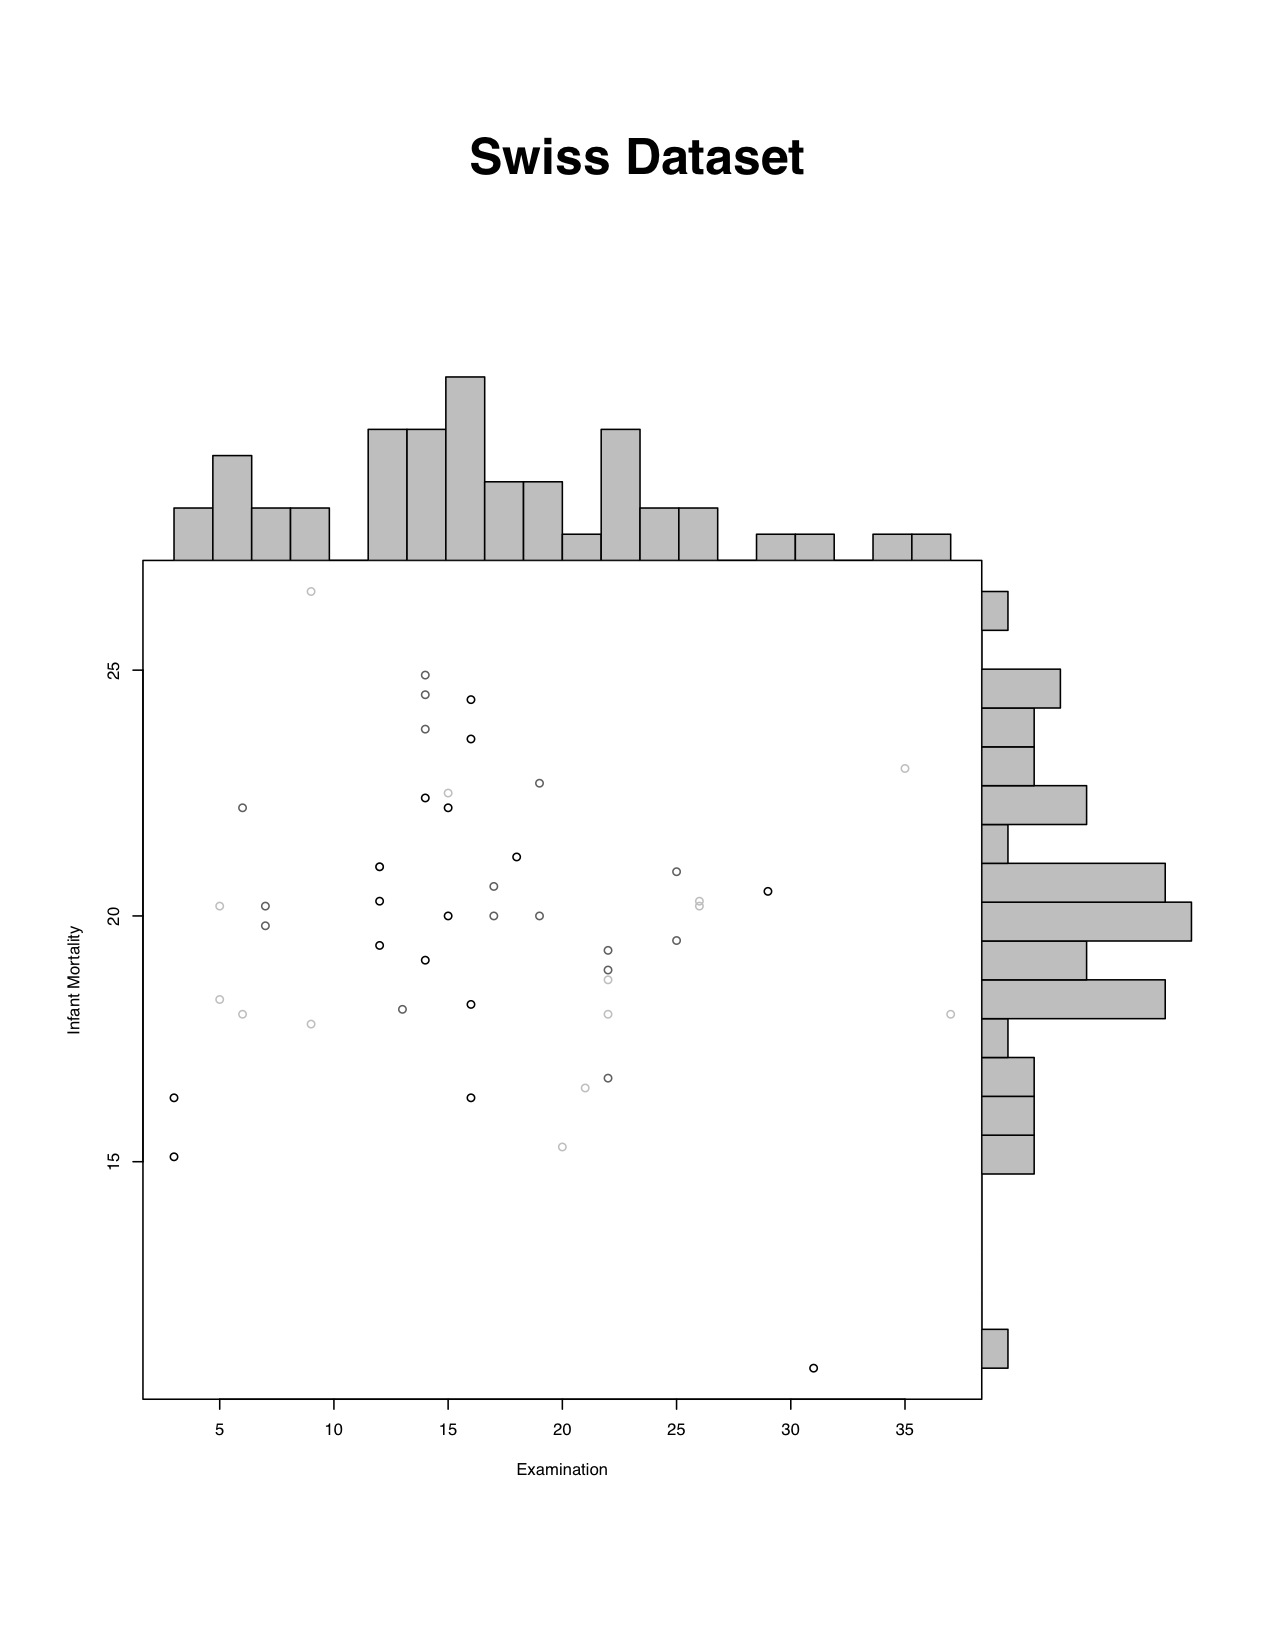
Y~Y Plot
Example - Points and Histogram
 |
Code Used
### Using a toy data set due to example data sets not having more than one Y variable

#pdf(file="F:/Website/yyplot/base/baseyy-points-large.pdf", width = 8.5, height = 11)
Import
Data
Data
### Import Data
require(datasets)
head(swiss)
### End Import
Set up/Plot
the graph
the graph
### Make Y~Y Plot
yyplot(
  x.column = "Examination",
  y.column = "Infant.Mortality",
  data=swiss,
  title.of.all.plots = "Swiss Dataset",
  xlab="Examination",
  ylab="Infant Mortality",
  color.of.middle.plot = color.gen("black","grey",3)
)
#dev.off()