a-b-line
Variation
Use
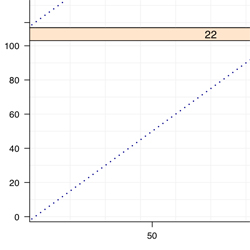
- To plot an abline
- Good for Y~Y plots
Arguments
- intercept
- - Y intercept of Graph
- slope
- - Slope of line
- black.and.white
- - Logical, Describes whether the line should be for grey scale or color output
Notes
- The same a-b-line will be plotted in each panel
Code
'plot.abline' <-
function(
  intercept = 0,
  slope = 1,
  black.and.white = black.and.white.in.panel
){
  cat("\nPlotting abline (",intercept,",",slope,")\n")

  if(black.and.white){
    line.color = "black"
    line.style = "dotted"
  }else{
    line.color = "darkblue"
    line.style = "dotted"
  }
  line.thickness = 2

  panel.abline(
    a = intercept,
    b = slope,
    col = line.color,
    lwd = line.thickness,
    lty = line.style
  )
}
Legend Info
key = list(
  title = "Legend",
  text = list(
    c("(0,1) Line"),
    col="black"
  ),
  points = list(
    col = c(if(bw){c("black")}else{c("darkblue")}),
    pch = c(NA),
    cex = c(1)*0.75
  ),
  lines = list(
    col = c(if(bw){c("black")}else{c("darkblue")}),
    lwd = c(2)*0.75,
    lty = c("dotted")
  ),
  type = "l",
  space = "right",
  cex.title = 1,
  cex = 0.75
)