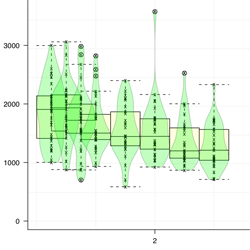
Box and Whiskers, Violin
Variation
Box and Whisker
Use
- To plot a box and whisker plot
Arguments
- points.x
- - All X values of points that will be plotted
- points.y
- - All Y values of points that will be plotted
- minimum.required
- - Minimum number of points required to form a box plot
- black.and.white
- - Logical, Describes whether the line should be for grey scale or color output
Notes
- minimum.required may be set to 1 for plot a box plot for every unique time point
- Remove the '#' before the cats to see what the function is doing
Code
'plot.box.and.whiskers' <-
function(
  points.x = x,
  points.y = y,
  minimum.required = 6,
  black.and.white = black.and.white.in.panel
){
cat("\nPlotting Box and Whiskers\n")
  ### Box Plot Box Color (Default color is blue)
  box.rectangle <- trellis.par.get("box.rectangle")
  box.rectangle$col <- "black"
  trellis.par.set("box.rectangle", box.rectangle)

  ### Box Plot Outliers
  outlier.color <- "black"
  plot.symbol <- trellis.par.get("plot.symbol")
  plot.symbol$col <- outlier.color
  plot.symbol$cex <- 1
  trellis.par.set("plot.symbol", plot.symbol)

  ### Box Plot Whiskers
  whisker.color <- "black"
  box.umbrella <- trellis.par.get("box.umbrella")
  box.umbrella$col <- whisker.color
  trellis.par.set("box.umbrella", box.umbrella)


  if(black.and.white){
    boxfill.color <- "grey 90"
  }else{
    boxfill.color <- "light yellow"
  }

  table.points.x <- table(points.x)
  locations.x <- table.points.x[table.points.x >= minimum.required]
  x.names <- as.numeric(names(locations.x))

  if(length(x.names) > 0){
    x.box.points <- points.x[points.x %in% x.names]
    y.box.points <- points.y[points.x %in% x.names]
      ### Select only locations that contained the minimum requirement

#cat("Table of X.Points\n");print(table.points.x)
#cat("X Points that Passed");print(x.names)
#cat("x.box.points");print(x.box.points)
#cat("y.box.points");print(y.box.points)

    panel.bwplot(
      x = x.box.points,
      y = y.box.points,
      horizontal = FALSE,
      color = "black",  ### Color of "dot at median"
      pch="|",  ### Creates a horizontal line at the median, instead of a solid dot.  Omit if you like the 'dot' better.
      fill = boxfill.color
    )
  }else{
    cat("\nWarning!\n
          \tPlease lower the minimum required for the box and whisker plot to allow boxes to be plotted.\n
          \t(Only if desired)\n")
  }
}
Legend Info
key = list(
  title = "Legend",
  text = list(
    c("Box and Whisker Outliers"),
    col="black"
  ),
  points = list(
    col = c("black"),
    pch = c(1),
    cex = c(1.5)*0.75
  ),
  lines = list(
    col = c("black"),
    lwd = c(1)*0.75,
    lty = c("blank")
  ),
  type = "l",
  space = "right",
  cex.title = 1,
  cex = 0.75
)