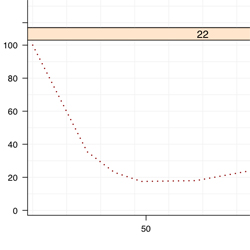
Mean Line
Variation
Use
- To plot a mean line
Arguments
- points.x
- - All X values of points that will be plotted
- points.y
- - All Y values of points that will be plotted
- line.style
- - Describes the style that the line should be plotted in. Please refer to the Documents if you wish to change it.
- minimum.required
- - Minimum number of points required to do a calculation
- - Helps with having the line not jump for one point that was just off of the rest
- black.and.white
- - Logical, Describes whether the line should be for grey scale or color output
Notes
- minimum.required may be set to 1 to include every unique time point
- 'panel.average()' would be used, but does not have a 'minimum.required' argument
- Remove the '#' before the cats to see what the function is doing
Code
'plot.mean.line' <-
function(
	points.x = x,
	points.y = y,
	line.style = "dotted",
	minimum.required = 2,
	black.and.white = black.and.white.in.panel
){
	cat("\nPlotting Mean Line\n")

	if(black.and.white){
		line.color <- "black"
		line.thickness <- 2
	}else{
		line.color <- "darkred"
		line.thickness <- 2
	}


	table.points.x <- table(points.x)
	unique.ordered.points.x <- names(table.points.x[table.points.x >= minimum.required])
#cat("\ntable.points.x\n");print(table.points.x >= minimum.required)
#cat("\nunique.ordered.points.x\n");print(unique.ordered.points.x)

	avg.y.points <- sapply(unique.ordered.points.x,function(x,s.points.y = points.y, s.points.x = points.x){
		s.points.mean <- mean( s.points.y[s.points.x %in% x] )
		return(s.points.mean)
	})

#cat("\navg.y.points\n");print(avg.y.points)
	if(length(unique.ordered.points.x > 0)){
		panel.lines(x = unique.ordered.points.x, y = avg.y.points, lwd = line.thickness, lty = line.style, col = line.color)
	}else{
		cat("\nWarning!\n
        \tPlease lower the minimum required for the mean line to allow the line to be plotted.\n
        \t(Only if desired)\n")
	}
}
Legend Info
key = list(
  title = "Legend",
  text = list(
    c("Mean Lines"),
    col="black"
  ),
  points = list(
    col = c(if(bw){c("black")}else{c("darkred")}),
    pch = c(NA),
    cex = c(1)*0.75
  ),
  lines = list(
    col = c(if(bw){c("black")}else{c("darkred")}),
    lwd = c(2)*0.75,
    lty = c("dotted")
  ),
  type = "l",
  space = "right",
  cex.title = 1,
  cex = 0.75
)