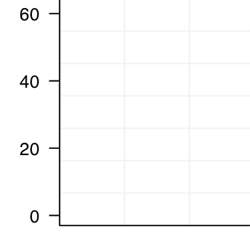
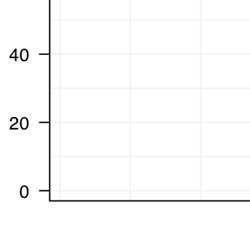
Grid
Variation
Use
- To plot a grid in the background
Grid Simple
Arguments
- x.divisions
- - Number of divisions along the X axis
- y.divisions
- - Number of divisions along the Y axis
- grid.color
- - Should be left at "grey95". It is a very light grey, close to white.
Notes
- Grid Simple will create the grid according to the final X and Y limits
- Having the 3% buffer within the xyplot() function is NOT necessary
Code
'plot.grid.simple' <-
function(
	x.divisions = 10,
	y.divisions = 10,
	grid.color = "grey95"
){
cat("\nPlotting Simple Grid\n")

	panel.grid(
		h = y.divisions,
		v = x.divisions,
		col = grid.color
	)
}
Legend Info
### Not Necessary
Grid Buffer
Arguments
- x.divisions
- - Number of divisions along the X axis
- y.divisions
- - Number of divisions along the Y axis
- grid.color
- - Should be left at "grey95". It is a very light grey, close to white.
- x.limits
- - The limits of the X range
- y.limits
- - The limits of the Y range
Notes
- plot.grid will create the grid according to the X and Y limits, before the 3% buffer is added
- Having the 3% buffer within the xyplot() function IS necessary
- Has a more 'polished' look to it
Code
'plot.grid' <-
function(
	x.divisions = 10,
	y.divisions = 10,
	grid.color = "grey95",
	x.limits = data.to.plot.in.panel[["x.lim"]],
	y.limits = data.to.plot.in.panel[["y.lim"]]
){
cat("\nPlotting Grid\n")

	tmp.h <- (0:y.divisions)/y.divisions *(diff(y.limits)) + y.limits[1]
	tmp.v <- (0:x.divisions)/x.divisions *(diff(x.limits)) + x.limits[1]

	panel.abline(h = tmp.h,v = tmp.v,col = "grey95")
}
Legend Info
### Not Necessary

