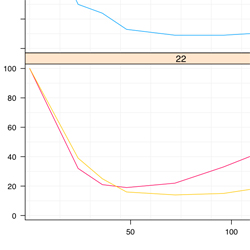
Lines By ID
Variation
Use
- To plot lines according to the ID number
Arguments
- points.x
- - All X values of points that will be plotted
- points.y
- - All Y values of points that will be plotted
- ids
- - Equals 'groups'
- - Supplied from the 'groups' in xyplot()
- rows.being.used
- - Equals 'subscripts'
- - Supplied from xyplot()
- black.and.white
- - Logical, Describes whether the line should be for grey scale or color output
Notes
- If black.and.white == TRUE
- Each ID will have it's own unique color
- The unique color will be consistent if and only if the exact same IDs are used
- Remove the '#' before the cats to see what the function is doing
Code
'lines.by.id' <-
function(
  points.x = x,
  points.y = y,
  ids = groups,
  rows.being.plotted = subscripts,
  black.and.white = black.and.white.in.panel
){
cat("\nPlotting Lines Connected by ID\n")

  unique.ids <- unique(ids)

  if(black.and.white){
    colors.unique <- c(rep(1,length(unique.ids) ))
    line.style <- "dashed"
  }else{
    colors.unique <- rainbow( length(unique.ids) ,start = .56,end = .13)
      #Colors blue to purple to red to orange, no yellow and green
    line.style <- "solid"
  }

  panel.superpose(
    x = points.x,
    y = points.y,
    subscripts = rows.being.plotted,
    groups = ids,
    panel.groups = "panel.lines", # Panel used to plot the data
    col = colors.unique,
    pch = NA,
    lty = line.style,
    type = "l",
    alpha = 1  # The opacity of the lines
  )
}
Legend Info
key = list(
  title = "Legend",
  text = list(
    c("ID Lines"),
    col="black"
  ),
  points = list(
    col = c(if(bw){c("black")}else{rainbow(1,start=.56,end=.55)}),
    pch = c(NA),
    cex = c(1)*0.75
  ),
  lines = list(
    col = c(if(bw){c("black")}else{rainbow(1,start=.56,end=.55)}),
    lwd = c(1)*0.75,
    lty = if(bw){"dashed"}else{"solid"}
  ),
  type = "l",
  space = "right",
  cex.title = 1,
  cex = 0.75
)
