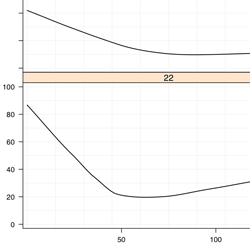
Loess Line
Variation
Use
- To plot a Loess line
Arguments
- points.x
- - All X values of points that will be plotted
- points.y
- - All Y values of points that will be plotted
- line.thickness
- - Default to 1.4. The default when plotting a regular line is 1.
- line.style
- - Describes the style that the line should be plotted in. Please refer to the Documents if you wish to change it.
- line.color
- - Default is "black"
- line.span
- - Please refer to the Documents on Span
Notes
- This is not the same as Lowess line. Please refer to the Documents to read about the differences
Code
'plot.loess' <-
function(
  points.x = x,
  points.y = y,
  line.thickness = 1.4,
  line.style = "solid",
  line.color = "black",
  line.span = 5/6
){
cat("\nPlotting Loess Line\n")

  if(length(points.x) > 1){
    panel.loess(
      x = points.x,
      y = points.y,
      lwd = line.thickness,
      lty = line.style,
      col = line.color,
      span = line.span
    )
  }else{
    cat("\nNot enought points to plot a Loess line\n")
  }
}
Legend Info
key = list(
  title = "Legend",
  text = list(
    c("Loess Line"),
    col="black"
  ),
  points = list(
    col = c("black"),
    pch = c(NA),
    cex = c(1)*0.75
  ),
  lines = list(
    col = c("black"),
    lwd = c(1.4)*0.75,
    lty = c("solid")
  ),
  type = "l",
  space = "right",
  cex.title = 1,
  cex = 0.75
)