Administration Range
Variation
Administration Time, Single Dose
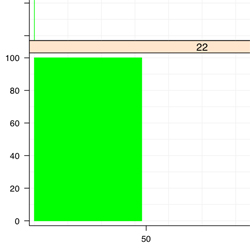
Use
- To plot the range of administration times for a single dose
Arguments
- data.for.admin.time
- - List that contains a matrix of administration times and IDs
- ids
- - Equals 'groups'
- - Supplied from the 'groups' in xyplot()
- rows.being.used
- - Equals 'subscripts'
- - Supplied from xyplot()
- black.and.white
- - Logical, Describes whether the line should be for grey scale or color output
Notes
- Please click on the picture/code above to see how the "data.for.admin.time" is collected
- Remove the '#' before the cats to see what the function is doing
Code
'plot.administration.time' <-
function(
  data.for.admin.time = data.to.plot.in.panel,
  ids = groups,
  rows.being.used = subscripts,
  black.and.white = black.and.white.in.panel
){

  unique.ids <- unique(ids[rows.being.used])
  admin.time.data <- data.for.amt[["admin.time"]]

#cat("\n\nAdmin. Time Data\n");print(amt.data)

  admin.time.data.select <- c(admin.time.data[admin.time.data[,"ID"] %in% unique.ids,"TIME"] )
    #To select the administration times where the IDs are being plotted

#cat("\n\nSelected Admin. Time Data\n");print(amt.data.select)

  if(black.and.white){
    polygon.color = "grey50" #medium grey
    amt.color = "grey5" #almost black
  }else{
    polygon.color = "green"
    amt.color = "green"
  }

  if(length(admin.time.data.select) > 0){
    cat("\nPlotting Administration time\n")

    admin.time.range <- range(admin.time.data.select)

    if(amt.range[1] == amt.range[2]){
      panel.abline(v = amt.range[1],col = amt.color)
    }else{
      polygon.points <- rbind(
        c(admin.time.range[1],y.min.lim),
        c(admin.time.range[2],y.min.lim),
        c(admin.time.range[2],y.max.lim),
        c(admin.time.range[1],y.max.lim)
      )
      panel.polygon(polygon.points,col = polygon.color,border = polygon.color)
    }

  }else{
    cat("\n There is no Administration Times being used. Administration lines will not appear. \n")
  }
}
Administration Range, Multiple Doses
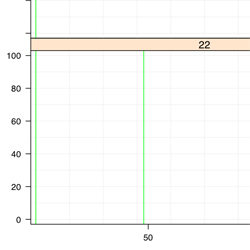
Use
- To plot the individual administration times for a multiple doses
Arguments
- data.for.admin.time
- - List that contains a matrix of administration times and IDs
- ids
- - Equals 'groups'
- - Supplied from the 'groups' in xyplot()
- rows.being.used
- - Equals 'subscripts'
- - Supplied from xyplot()
- black.and.white
- - Logical, Describes whether the line should be for grey scale or color output
Notes
- Please click on the picture/code above to see how the "data.for.admin.time" is collected
- Remove the '#' before the cats to see what the function is doing
Code
plot.administration.time.multi <-
function(
  data.for.amt = data.to.plot.in.panel,
  ids = groups,
  rows.being.used = subscripts,
  black.and.white = black.and.white.in.panel
){

  unique.ids <- unique(ids[rows.being.used])
  amt.data <- data.for.amt[["amt"]]

#cat("\n\nAMT Data\n");print(amt.data)

  amt.data.select <- c(amt.data[amt.data[,"ID"] %in% unique.ids,"TIME"] )
    #To select the administration times where the IDs are being plotted

cat("\n\nSelected AMT Data\n");print(amt.data.select)

  if(black.and.white){
    polygon.color = "grey50" #medium grey
    amt.color = "grey5" #almost black
  }else{
    polygon.color = "green"
    amt.color = "green"
  }

  if(length(amt.data.select) > 0){
    cat("\nPlotting Administration time\n")

    panel.abline(v = unique(amt.data.select),col = amt.color)
      #Plot the unique times

  }else{
    cat("\n There is no AMT times being used. AMT lines will not appear. \n")
  }
}
Legend Info
key = list(
  title = "Administration Range",
  text = list(
    c("Points"),
    col="black"
  ),
  points = list(
    col = c(if(bw){c("grey25")}else{c("green")}),
    pch = c(15),
    cex = c(2)*0.75
  ),
  lines = list(
    col = c(if(bw){c("grey25")}else{c("green")}),
    lwd = c(1)*0.75,
    lty = c("solid")
  ),
  type = "l",
  space = "right",
  cex.title = 1,
  cex = 0.75
)