95% Confidence Interval
Variation
Use
- To see the 95 percent confidence interval of the mean
- To combine it with the Box and Whisker plot's whiskers and outliers
Arguments
- points.x
- - All X values of points that will be plotted
- points.y
- - All Y values of points that will be plotted
- distribution
- - Defines what method to use when calculating the interval. Choices are "t" and "normal".
- y.limits
- - Needs to be supplied the limits of the Y data. Can be derived within panel due to having another panel with different limits.
- ci95.ghost
- - What percentage of opacity should be used. 1 being solid, 0 be 'invisible'
- whiskers.and.outliers
- - Logical. Decides whether or not to plot the whiskers and circle the outliers.
Notes
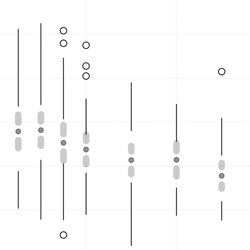
- Explaination of the graphic (from middle out)
- Center large dot - Mean
- Bold/thick lines
- 95% Confidence Interval of the mean
- Stops near the Mean Dot as to not overlap
- Does include the interval inbetween the two lines
- Thin lines - The 'whisker' part of Box and Whisker plot. (The boxes are set to be transparent.)
- Circles - Outliers
- N = ## - Number of points used
- Due to the 'ci95.ghost', this panel function may be place almost anywhere.
- The rounded ends from the confidence interval are due to the defaults in Lattice that could not be changed.
- If you do not like the 'N=##' at the bottom. Remove it in the code.
Code
'plot.ci95.whisker' <-
function(
  points.x = x,
  points.y = y,
  distribution = "t", #"normal"
  y.limits = NULL,
  ci95.ghost = 1,
  whiskers.and.outliers = FALSE
){
cat("\nPlotting 95% Confidence Interval\n")

  if(is.null(y.limits)) stop("\n\n\ty.limits was not supplied\n\n")

  y.split <- split(points.y,points.x)
  x.locations <- as.numeric(names(y.split))

  for( i in x.locations){
    x <- i
    y <- y.split[[as.character(x)]]
    a <- mean(y)
    s <- sd(y)
    n <- length(y)
    if(distribution == "t") error <- qt(0.975,df=n-1)*s/sqrt(n)
    if(distribution == "normal") error <- qnorm(0.975)*s/sqrt(n)

    top.ci <- a + error
    bot.ci <- a - error

    ### Plot Lower Interval
    lsegments(
      x0 = x,  # X Start
      y0 = bot.ci,  #Y Start
      x1 = x,  # X Finish
      y1 = min(a,c(a - 0.02*diff(y.limits))),  # Y Finish, with 2% buffer away from center point (creates white space)
      col = "black",
      lty = 1,
      lwd = 8,
      alpha = .25
    )

    ### Plot Upper Interval
    lsegments(
      x0 = x,
      y0 = top.ci,
      x1 = x,
      y1 = max(a,c(a + 0.02*diff(y.limits))),
      col = "black",
      lty = 1,
      lwd = 8,
      alpha = .25
    )

    ### Plot Mean Dot
    lpoints(
      x = x,
      y = a,
      pch = 16, # Solid Circle
      col = "black",
      cex = .75,
      alpha = ci95.ghost
    )

    ### Write how many points there are at the bottom
    ltext(
      x = x,
      y = c(y.limits[1]-diff(y.limits)*0),  # To have the text written in the 3% buffer
      offset = 0,
      labels = c(paste("N =",n,sep=" ",collapse="")),
      cex = .5,
      srt = 90,  # Rotate text 90 degrees
    )


    ### Make Box Plot Box Color Transparent
    box.rectangle <- trellis.par.get("box.rectangle")
    box.rectangle$col <- "transparent"
    trellis.par.set("box.rectangle", box.rectangle)

    ### Make Box Plot Outliers Circles
    outlier.color <- "black"
    plot.symbol <- trellis.par.get("plot.symbol")
    plot.symbol$col <- outlier.color
    plot.symbol$cex <- 1
    trellis.par.set("plot.symbol", plot.symbol)

    ### Make Box Plot Whiskers Black, Solid, and See Through
    whisker.color <- "black"
    box.umbrella <- trellis.par.get("box.umbrella")
    box.umbrella$alpha <- ci95.ghost
    box.umbrella$col <- whisker.color
    box.umbrella$lty <- "solid"
    trellis.par.set("box.umbrella", box.umbrella)

    ### Make Whiskers and Outliers
    if(whiskers.and.outliers){
      panel.bwplot(
        x = rep(x,length(y)),
        y = y,
        horizontal = FALSE,
        color = "white",  ### Best way known how to remove the dot
        pch=".", ### Best way known how to remove the dot
        cex = 0.000001, ### Best way known how to remove the dot
        fill = "transparent",  # Makes box see-through
        box.width = 0 # Makes whisker top line disappear
      )
    }


#cat("\n\n\nX");print(x)
#cat("a");print(a)
#cat("s");print(s)
#cat("n");print(n)
#cat("error");print(error)
#cat("top.ci");print(top.ci)
#cat("bot.ci");print(bot.ci)
#cat("diff");print(0.02*diff(y.limits))

  }

}
Legend Info
key = list(
  title = "Legend",
  text = list(
    c("Points"),
    col="black"
  ),
  points = list(
    col = c("black"),
    pch = c(4),
    cex = c(1)*0.75
  ),
  lines = list(
    col = c("black"),
    lwd = c(1)*0.75,
    lty = c("blank")
  ),
  type = "l",
  space = "right",
  cex.title = 1,
  cex = 0.75
)